Computed Variables and Bucketing: Turn Survey Data into Clear, Actionable Insights
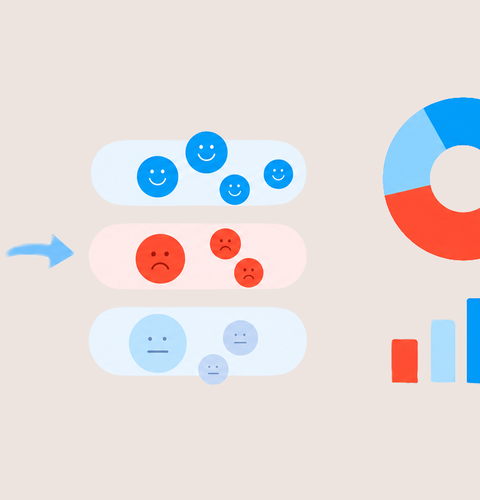
When you design a survey, your goal is to capture nuance. When it comes time to report on the results, however, clarity becomes essential. Bridging that gap isn't always easy — and if you've ever exported survey data to a spreadsheet just to manually regroup responses, you've experienced the challenge firsthand.
Fortunately, there's a better way. Computed variables and bucketing make it easy to collect detailed survey data while presenting clear, decision-ready insights — without the manual work of exporting and regrouping data in a spreadsheet.
A quick example before we go further
Say you ask respondents: "How satisfied are you with our service?" on a 0–10 scale.
Your raw data comes back with ten distinct values. Useful for collection — but hard to present. With bucketing, you map those values into three clear groups:
- High: 9–10
- Medium: 7–8
- Low: 0–6
Instead of a cluttered chart, your stakeholders see: High: 42% | Medium: 33% | Low: 25%. The same data with a clearer story.
What are computed variables?
Computed variables are a reporting layer you build on top of your raw survey data. They let you create new categories for display purposes — without modifying a single response, changing survey logic, or affecting how respondents experience your survey.
In SimpleSurvey, computed variables work like this: you define how existing responses should be grouped, and the platform applies that grouping in your reports automatically. You can adjust or redefine the groupings at any time — even after data has been collected — without rerunning the survey.
What is bucketing?
Bucketing is the method used inside computed variables to combine detailed values into broader categories. It's sometimes called grouping or binning.
The satisfaction scale example above is bucketing in action: ten granular values collapsed into three meaningful segments. The same logic applies to any scaled or ranged response — age brackets, frequency ratings, performance scores, and more.
One important thing to know: any value you don't assign to a bucket won't appear in your grouped results and won't be counted in your percentages. Make sure every relevant value is accounted for, or that any exclusions are intentional.
Why this matters for your reporting workflow
You stop compromising your survey design
Good surveys use precise scales. But precise scales are hard to report on. Without a grouping layer, teams often simplify their answer options upfront just to make reporting easier — which means collecting less useful data.
Computed variables break that trade-off. You can design your survey for data quality and configure your reporting for clarity, independently.
You eliminate manual data work
The most common workaround without built-in grouping: export your data, recode values manually in Excel, and rebuild your charts. It works — but it's time-consuming, error-prone, and has to be repeated every time something changes.
In SimpleSurvey, grouping is defined once and applied automatically in every report and dashboard that uses those variables. There's nothing to re-export or manually recode.
You can adapt reporting as needs evolve
Stakeholders change. KPIs shift. New segmentation questions come up after the survey has already closed. Computed variables let you regroup your data at any point without going back to the field. New stakeholder wants outcomes broken into four tiers instead of three? Change the bucket boundaries and your reports update instantly.
Your data becomes easier to analyze and share
Grouped data is easier to filter, compare, and visualize. It's also easier for non-technical audiences to act on. Computed variables turn your raw results from something you have to interpret into something you can present directly.
Common use cases
Satisfaction surveys — Group NPS or CSAT scores into promoter/neutral/detractor tiers, or high/medium/low segments.
Employee and stakeholder surveys — Translate detailed Likert scale responses into clear sentiment categories for leadership reporting.
Demographics — Combine granular age or income ranges into broader audience segments without losing the underlying data.
Program or performance measurement — Group outcome scores into tiers (e.g., exceeds / meets / below expectations) to support evaluation and reporting.
Best practices for effective bucketing
Keep the number of buckets small. Three to five categories is usually the right range. More than that and you lose the simplicity that makes bucketing worthwhile.
Use clear, self-explanatory labels. High / Medium / Low. Positive / Neutral / Negative. Labels your audience understands without a legend.
Make sure ranges don't overlap. Each response value should belong to exactly one bucket. Gaps or overlaps will distort your results.
Account for every value intentionally. Any value left out of your bucket definitions won't appear in grouped results. This can quietly skew percentages if it's not deliberate — so review your ranges carefully before publishing reports.
The bottom line
If your current workflow involves exporting survey data just to regroup it in a spreadsheet, that's a sign your reporting tools aren't doing enough of the work.
SimpleSurvey's computed variables and bucketing let you preserve the detail in your raw data, define how results are grouped, and adjust that grouping anytime — all without manual data handling. Your reports stay current, your data stays intact, and your insights are ready to act on.
Ready to see it in action? Explore SimpleSurvey's survey features and reporting tools and learn how flexible data collection and reporting can work for your team.